PS: 34,1%
PSD: 29,5%
CDU: 9,1%
CDS-PP: 8,3%
BE: 7,2%
Here. Other findings: massive government disapproval and preference over cutting expenditure over increasing taxes, although this last question appears to have been formulated in a way - "Should the government cut expenditures instead of increasing taxes?" - that is probably not the best. Also interesting is where people thought where cuts should be made: 61% public companies, 38% local government, 0,7% education, 0,3% health. Besides the question of what the response categories actually were, one wonders how many respondents understood the real implications of their answers...
segunda-feira, outubro 22, 2012
sexta-feira, outubro 19, 2012
Polls in Portugal, update
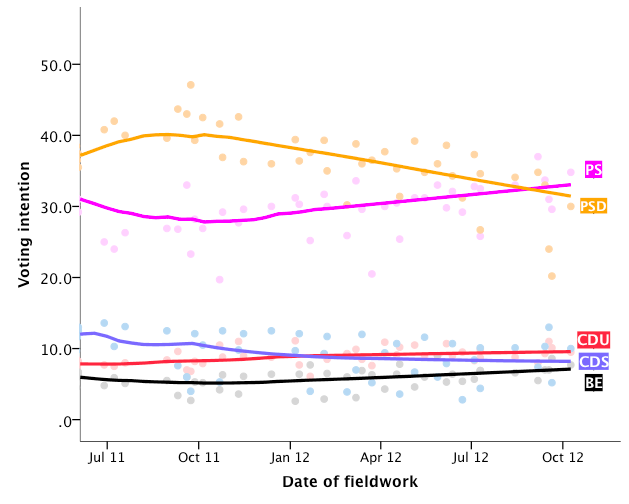
The LOWESS line uses a 25% bandwidth. The rest is self-explanatory, I trust.
segunda-feira, outubro 15, 2012
Rescaldo sondagens Açores
Pouca coisa para trabalharmos. O site da ERC regista uma sondagem de intenção de voto, realizada pela Eurosondagem, com trabalho de campo terminado a 2 de Outubro. Entre parêntesis, diferença em relação aos que vieram a ser os resultados finais:
PS: 41,9% (-7,1)
PSD: 35% (+2)
CDS-PP: 9.7% (+4)
CDU: 3,7% (+1,8)
BE: 3,3%(+1)
O erro absoluto médio é 3,2, bastante acima do que sucede normalmente em sondagens nacionais. A sondagem à boca das urnas da Católica teve resultados, como teria de ser devido à sua natureza, bastante melhores:
PS: 50% (+1)
PSD: 31% (-2)
CDS-PP: 7.5% (+1.8)
CDU: 3% (+1.1)
BE: 3%(+0.7)
Desvio absoluto médio de 1.3, igual ao que se passou em 2008. E uma curiosidade: esta é a segunda eleição seguida, depois das legislativas, em que o CDS-PP é sobrestimado pelas sondagens. Algo se deverá estar a passar, ou no eleitorado do CDS ou nas sondagens.
sábado, outubro 13, 2012
terça-feira, outubro 02, 2012
Marktest, 17-20 Sept, N=805, Tel.
PS: 29.6% (+3.8)
PSD: 20.2% (-6.5)
CDU: 10.1% (+0.2)
BE: 8.6% (+1.7)
CDS-PP: 5.2% (+0.8)
Values in parentheses from previous July 2012 poll. Here.
PSD: 20.2% (-6.5)
CDU: 10.1% (+0.2)
BE: 8.6% (+1.7)
CDS-PP: 5.2% (+0.8)
Values in parentheses from previous July 2012 poll. Here.


segunda-feira, outubro 01, 2012
Before the debates: polls and forecasts
Two days before the first debate, where do we stand in terms of election forecasts for the US presidential election?
1. Polls: polls are not forecasts, but they are of course informative. One obvious argument is that, the closest we get to the election, the less likely it is that any factor will emerge that may change the balance of forces. But the other - actually more plausible - argument is that, the more time elapses and the campaign progresses, the more likely it is that voters' intentions reflect the "fundamentals" of the election and the latent preferences of voters. At the moment, all poll aggregators place Obama ahead by about 4 points.
2. Models: econometric models use data from past elections, at the national or state level, and a number of contextual variables (mostly from the economy - such as change in national or per capita income, unemployment, and others - and sometimes from approval polls) to predict outcomes. The latest issue of PS collects almost all of them. The average is 50.4 for Obama, an extremely narrow advantage. An article using ensemble Bayesian model averaging of those models estimates that "between 46.4% and 52.5% of the US voters will support the incumbent in 2012, and there is a 0.60 probability that the vote for Obama will be greater than 50%." Very close indeed.
3. Prediction markets: these are markets where investors buy and sell shares of political outcomes. Their performance has been extremely good, although there is a debate on whether they are "superior" to polls when the latter are properly treated. In any case, this is what the markets have been telling us until now:
Iowa Vote Share:

Iowa probability of winning:

Intrade Obama's probability of winning:

1. Polls: polls are not forecasts, but they are of course informative. One obvious argument is that, the closest we get to the election, the less likely it is that any factor will emerge that may change the balance of forces. But the other - actually more plausible - argument is that, the more time elapses and the campaign progresses, the more likely it is that voters' intentions reflect the "fundamentals" of the election and the latent preferences of voters. At the moment, all poll aggregators place Obama ahead by about 4 points.
2. Models: econometric models use data from past elections, at the national or state level, and a number of contextual variables (mostly from the economy - such as change in national or per capita income, unemployment, and others - and sometimes from approval polls) to predict outcomes. The latest issue of PS collects almost all of them. The average is 50.4 for Obama, an extremely narrow advantage. An article using ensemble Bayesian model averaging of those models estimates that "between 46.4% and 52.5% of the US voters will support the incumbent in 2012, and there is a 0.60 probability that the vote for Obama will be greater than 50%." Very close indeed.
3. Prediction markets: these are markets where investors buy and sell shares of political outcomes. Their performance has been extremely good, although there is a debate on whether they are "superior" to polls when the latter are properly treated. In any case, this is what the markets have been telling us until now:
Iowa Vote Share:
Iowa probability of winning:
Intrade Obama's probability of winning:
Subscrever:
Mensagens (Atom)